Soft soil
The Soft soil model, originally proposed in [1], is expected to find its application in the modeling of considerably soft soils with a high degree of compressibility, for which the application of the Hardening soil model may prove inadequate. Similarly to the Hardening soil model the Soft soil model is represented by two yield surfaces. The shear yield surface is based on the Matsuoka-Nakai failure criterion and the compression cap is formulated here on the basis of the Generalized Cam-clay model. Their projections into the deviatoric plane are smoothed convex curves passing through the vertexes of the Mohr-Coulomb model. A graphical representation is provided in the following figure.
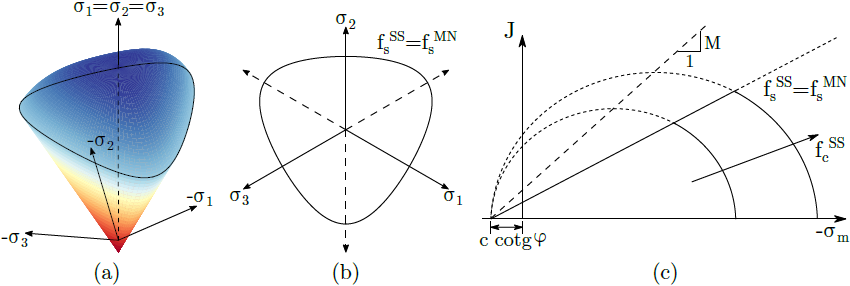 a) yield surface in principal stress space, b) projection into deviatoric and c) meridian planes
Unlike the Generalized Cam-clay model the slope of the critical state line M is defined in terms of the coefficient of lateral earth pressure at rest for normally consolidated soils K0N and stiffness parameters κ*, λ* in the form
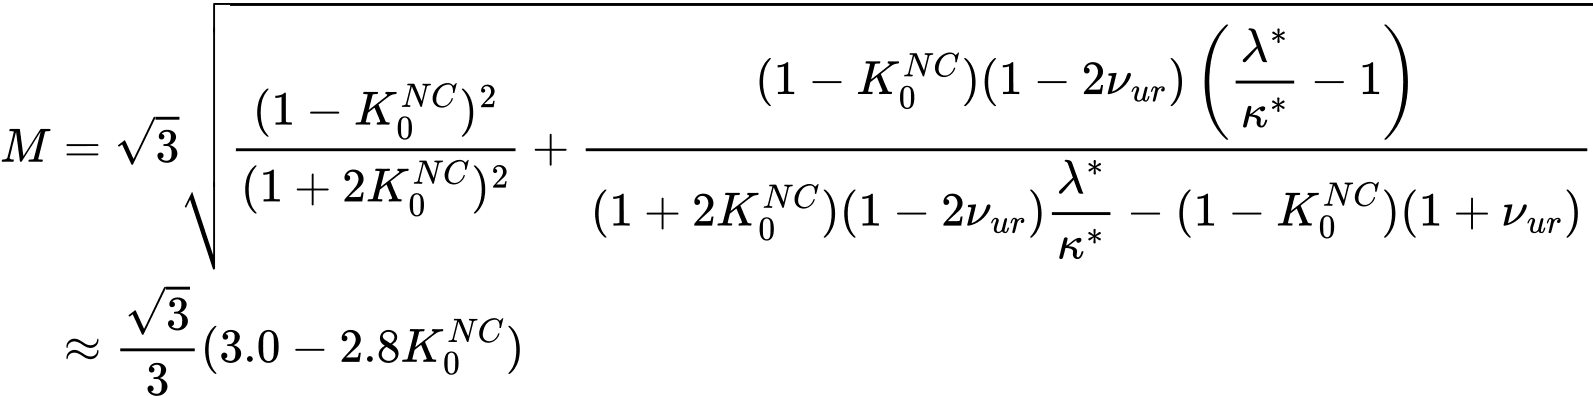
Further details concerning the parameters κ*, λ* are provided in the description of the Modified Cam-clay model. The reason for this particular definition is the fact that for example the value of parameter M which in the Modified Cam-clay model gives a correct shearing resistance may suggest the value of K0NC considerably exceeding the value provided by the Jaky formula for a given value of the angle of internal friction φ. Further details can be found in [1].
The shear yield surface is assumed to comply with the behavior provided by the elastic-perfectly plastic material model. On the other hand, the compression cap may, unlike the Generalized Cam-clay, undergo only hardening. In other words, the preconsolidation pressure pc that drives the evolution of the compression cap may only increase, see also the description of the Modified Cam-clay. Such a limitation imposes certain constrains to the selection of model parameters, particularly on the value of angle of internal friction φ. This requires the following condition to be satisfied
![]()
This condition should be satisfied even if
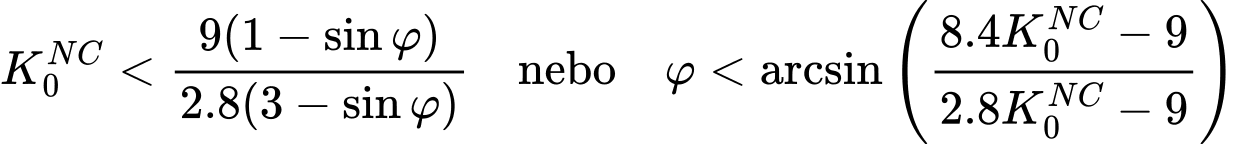
A graphical relationship between the shear yield surface and compression cap is illustrated in the following figure for two different values of K0NC and several values of the angle of internal friction φ for fixed values of parameters κ*, λ*, ν. It is clear that for combination of M(K0NC = 0.6) = 0.774 and φ = 40° the above conditions are not satisfied as for the first condition we get φmax = 33.2° < φ = 40°, while the second condition even requires φmax = 32.8°, see the green variant in figure (b).
Because the projections of both yield surfaces into the meridian plane depend on the Lode angle we present these figures for the case of triaxial compression. Details regarding the prediction of softening by the Generalized Cam-clay model can be found in the model description, see also comparison of the predictions provided by the Modified Cam-clay and Generalized Cam-clay models available here. Further details can be found in the theoretical manual.
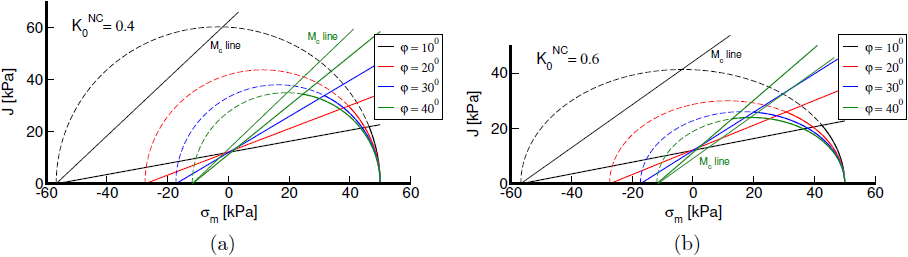 Compression and shear yield surfaces: : φ and K0NC: a) K0NC =0.4, b) K0NC =0.6
Evolution of the preconsolidation pressure pc as well as the meaning of individual parameters defining the basic constitutive relationships pertinent to the compression cap are explained in the description of the Modified Cam-clay model. The plastic potential function that drives the evolution of plastic strains in the region controlled by the shear yield surface is identical to that adopted for the Drucker-Pragerova model. It is therefore independent of the Lode angle. On the other hand, it depends on the dilatancy angle ψ (Mψ = Mψ(ψ)). In general, we assume that φ ≠ ψ, which corresponds to the non-associated flow rule. Similarly to the Drucker-Prager model the amount of dilation (evolution of positive volumetric plastic strains during plastic shearing) can be limited by introducing the maximum void ratio emax, for which reaching the critical state ψ = 0 is expected.
Parameters defining the Soft soil material model are summarized in the following table.
Symbol | Units | Description | |
|
| Slope of swelling line | |
|
| Slope of normal consolidation line | |
|
| Maximum void ratio on | |
|
| Poisson's ratio | |
| [kPa] | Effective coefficient of cohesion | |
|
| Effective angle of internal friction | |
|
| Dilatancy angle | |
|
| Coefficient of lateral earth pressure at rest for normally consolidated soil | |
|
| Maximum void ratio to terminate dilation (when limiting dilation) | |
|
| Overconsolidation ratio | |
| [kPa] | Preoverburden pressure | |
| [1/K] | Coefficient of thermal expansion (when considering temperature effects) | |
|
| Critical state friction angle (not inputted) | |
| [kPa] | Preconsolidation pressure |
Similarly to the Modified Cam-clay model the Young modulus of elasticity is not directly inputted but rather determined from the bulk modulus Ks given by
![]()
Clearly, the stiffness evolution, as in the case of the Modified Cam-clay model, depends on mean effective stress σm. Setting the initial values of the preconsolidation pressure pcin, the bulk modulus Ksin, and the initial void ratio ![]() is described in detail in the presentation of the Modified Cam-clay model.
is described in detail in the presentation of the Modified Cam-clay model.
This is closely related to the selection of the initial load step, which requires for very low values of initial stress to be sufficiently small. To speed up convergence it appears useful to exploit the Minimum number of iterations for a single load step. The influence of magnitude of the initial load step on the evolution of stress and strain is described in detail here.
Unlike other models of the Mohr-Coulomb type the initial void ratio ein, which corresponds to the state of soil at the end of the first calculation stage (geostatic stress), is not inputted but rather but rather computationally determined from the inputted value of void ratio e0 and the current state of stress, see also the description of the Modified Cam-clay model.
The model allows for adjusting the initial value of preconsolidation pressure pc in dependence on the expect degree of preconsolidation by using parameters ![]() and
and ![]() . Details can be found here. Point out that this option is available only when setting the initial geostatic stress with the help of K0 procedure.
. Details can be found here. Point out that this option is available only when setting the initial geostatic stress with the help of K0 procedure.
Providing the undrained conditions are required in the analysis one may proceed with the Type (1): analysis in effective stress (cef, φe) only.
The Soft soil model also allows for performing the stability analysis. However, this option is available only when running the stability analysis analysis within a given construction stage. In such a case, the compression cap is turned off. Therefore, only the shear yield surface may become active. The task is solved by gradually reducing the peak shear strength parameters c, φ in the same way as outlined for the Drucker-Prager model.
The model performance in the framework of simple laboratory tests is examined here including the comparative study with the Modified Cam-clay model, and the influence of magnitude of the initial load step.
Implementation of the Soft soil material model into the GEO5 FEM program is described in detail in the theoretical manual
Literature:
[1] R.B.J. Brinkgreve, Geomaterial Models and Numerical Analysis of Softening, PhD thesis, Technische Universiteit Delft, 1994. Available at https://repository.tudelft.nl/record/uuid:6738de62-4dde-45b0-b3bd-3635504767c2.